

This chart assumes that percentages were passed straight down through each generation, so a great-great grandparent represents 6.25% of my ancestry. I know the DNA passed down is much more random than that, so this was just a guesstimate at best.
For this chart, I put my Mom's origins at 100% British, but I've since found out that she may have some other European and Irish roots. My Dad's heritage was about 64% German, 12% Irish, 12% French, and 12% British/Unknown on paper. That gave me the following percentages:
British - 55%
German - 31%
Irish - 6.25%
French - 6.25%
Unknown - 1.5%
My Mom and I had our DNA tested through Ancestry.com last year, so I was curious to compare the DNA results to my original estimates based on my paper tree.
Here's my breakdown from Ancestry.com:


The first mystery was what happened to my Irish and German heritage? The second was where did all the Scandinavian DNA come from? I can guess that at least some of my German and Irish heritage is showing up as Scandinavian and/or British.
Even more surprising was my Mom's chart which looked more like what I expected mine to look like. She came up with 54% Great Britain, 27% Europe West and 13% Ireland and only 3% Scandinavian.
Given, that 50% of our DNA comes from each parent, this seems to indicate my Dad had a much higher percentage of British and Scandinavian roots than I can account for. Even if all of the DNA I inherited from my Mom was from her British lines, that would mean 23% of the British came from my Dad.
I transferred my results to Family Tree DNA and got the following breakdown:

Their definition of British Isles includes Ireland. This looks closer to what I expected, but shows an even larger Scandinavian percentage. On this chart, I have 22% Western and Central Europe vs. the 3-6% from Ancestry.com. My British Isles percentage dropped from 73% on Ancestry.com to 50%. That's quite a difference!
I also took a look at some of the Admixture tools on Gedmatch.com. For another comparison, here are my results with the Eurogenes EUTest:
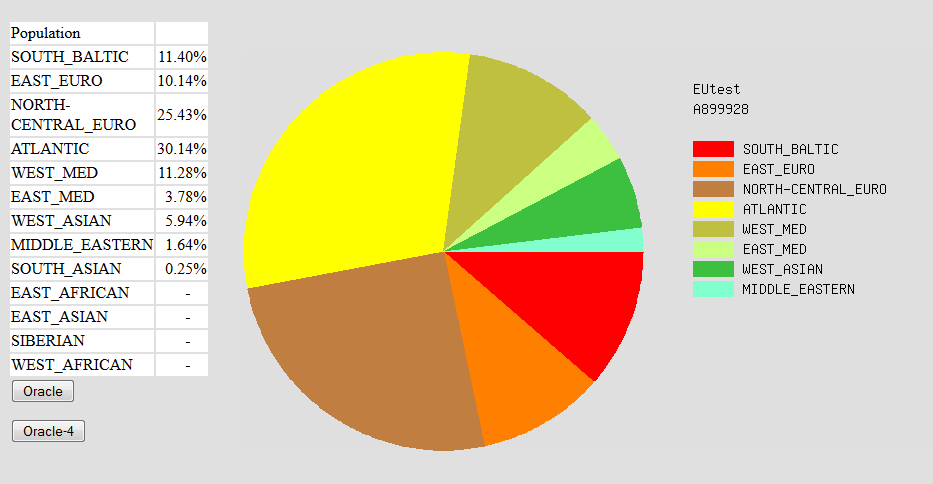

So, what does any of this mean? Each admixture chart is based on different algorithms and population databases, so comparing them against each other doesn't mean too much. According to Ancestry.com, the number of reference samples for a region and the similarity of one region to another can affect the accuracy of the results. In particular, they state that their results for Great Britain and Europe West are less accurate than for most of the other regions.
I would think the results will become more accurate as more people get tested and the reference populations for each region are refined. While the charts are fun to look at and can provide some clues on your origins, I wouldn't draw any conclusions from them.
No comments:
Post a Comment